26/06/2017
From the “Friendship Paradox” to the Assessment of Hurricane Impact using Twitter data
Computational Social Scientist
The story behind this project started in 2010 when I was based at UC San Diego. These were the early days of research using social media datasets. UCSD was a fascinating place to start doing this type of work for a young scholar like me. James Fowler, one of the brightest minds in my field, computational social science, was based on campus. James and Nicholas Christakis — known as the dynamic duo who uncovered the link between obesity and social relationships — had published one of my favorite papers in the field. In it, they have shown that the Friendship Paradox —the phenomenon by which your friends have more friends that you do, first discovered by Scott Feld in 1991 —could be used to detect flu outbreaks earlier than just by observing the general population.
Current methods for the detection of contagious outbreaks give contemporaneous information about the course of an epidemic at best. It is known that individuals near the center of a social network are likely to be infected sooner during the course of an outbreak, on average, than those at the periphery. Unfortunately, mapping a whole network to identify central individuals who might be monitored for infection is typically very difficult. We propose an alternative strategy that does not require ascertainment of global network structure, namely, simply monitoring the friends of randomly selected individuals. Such individuals are known to be more central. To evaluate whether such a friend group could indeed provide early detection, we studied a flu outbreak at Harvard College in late 2009. We followed 744 students who were either members of a group of randomly chosen individuals or a group of their friends. Based on clinical diagnoses, the progression of the epidemic in the friend group occurred 13.9 days (95% C.I. 9.9–16.6) in advance of the randomly chosen group (i.e., the population as a whole). The friend group also showed a significant lead time (p<0.05) on day 16 of the epidemic, a full 46 days before the peak in daily incidence in the population as a whole. This sensor method could provide significant additional time to react to epidemics in small or large populations under surveillance.
Christakis NA, Fowler JH (2010)
Social Network Sensors for Early Detection of Contagious Outbreaks.
PLoS ONE 5(9): e12948. doi:10.1371/ journal.pone.0012948
I had been very interested in a while in testing out if this “Friendship Paradox,” in the new social structures afforded by digital social media. Esteban Moro was visiting UC San Diego for the summer (from UC3M, Spain), and together with another fellow Spaniard on campus, Manuel Garcia-Herranz (who was visiting from UAM, Spain), we started to scrap some Twitter data and test it out. The preliminary results were promising: yes, the friendship paradox held on Twitter as well. But so what, we also wondered? Is this just another version of the friendship paradox phenomenon on the Internet? We decided to take this to James and Nicholas. They suggested that in the same way that the flu spread from person to person on the Harvard Campus, information also spread online and that perhaps the friendship paradox could also be used to detect global contagion on the Internet. We set out to do look into it, and after a lot of work, we demonstrated that, yes, we could use Friends as Sensors to Detect Global/Scale Contagious Outbreaks, also on the Internet.
Recent research has focused on the monitoring of global–scale online data for improved detection of epidemics, mood patterns, movements in the stock market political revolutions, boxoffice revenues, consumer behavior and many other important phenomena. However, privacy considerations and the sheer scale of data available online are quickly making global monitoring infeasible, and existing methods do not take full advantage of local network structure to identify critical nodes for monitoring. Here, we develop a model of the epidemic spread of information in a global scale, publicly articulated social network and show that a simple method can yield not just early detection, but warning of infectious outbreaks. In this approach, we randomly choose a small fraction of nodes in the network and then we randomly choose a friend of each node to include in a group for local monitoring. Using six months of data from most of the full Twittersphere, we show that this friend group is more central in the network and it helps us to detect viral outbreaks of the use of novel hashtags about 7 days earlier than we could with an equal sized randomly chosen group. Moreover, the method actually works better than expected due to network structure alone because highly central actors are both more active and exhibit increased diversity in the information they transmit to others. These results suggest that local monitoring is not just more efficient, but also more effective, and it may be applied to monitor contagious processes in global scale networks.
Garcia-Herranz M, Moro E, Cebrian M, Christakis NA, Fowler JH (2014)
Using Friends as Sensors to Detect Global¬ Scale Contagious Outbreaks.
PLoS ONE 9(4): e92413. doi:10.1371/journal.pone.0092413
This finding generated a significant burst of academic research on online applications of the friendship paradox (by Kristina Lerman et al. at University of Southern California, by K ay Axhausen et al. at ETH Zurich, by Y .H Eom et al. at the University of Toulouse). Their studies, like ours, showed that they were able to detect viral spreading the Internet, “informational spread,” but how about the real world? Could we use the friendship paradox to detect something happening in the physical sphere?
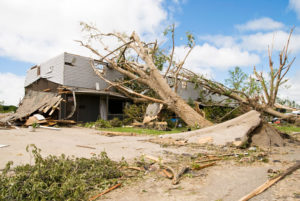
This quest restarted in 2012, when I was in my new post with NICTA (now Data61, after the merger of NICTA and CSIRO) the peak data science research body of Australia. I had joined Pascal Van Hentenryck (now at University of Michigan) who was an expert in real-time disaster management and mitigation. Pascal had recruited me to work together and explore if the real time information produced by social media was informative enough to improve the computational evacuation plans that he had been working on for years. As we were discussing this, Hurricane Sandy hit the US, and seeing the tremendous amount of devastation happening; we asked: could we use the friendship paradox again to detect early the destruction is going on the US East Coast? We embarked two talented postdoctoral associates in this mission: Caron Chen, a recent PhD in GIS, who set out to obtain as much data as possible from the Hurrican Sandy from Twitter; and Yury Kryvasheyeu, a recent PhD in Physics (Computational Modelling), who set out to see if the most connected individuals would ” tweet ” earlier than the others as the Hurricane hit them. And, again, it worked, Social Network Sensors were able to deliver early warnings during Hurricane Hurricane Sandy:
Information flow during catastrophic events is a critical aspect of disaster management. Modern communication platforms, in particular, online social networks, provide an opportunity to study such flow and derive early warning sensors, thus improving emergency preparedness and response. The performance of the social networks sensor method, based on topological and behavioral properties arising from the “friendship paradox,” is studied here for over 50 million Twitter messages posted before, during, and after Hurricane Sandy. We find that differences in users’ network centrality actually translate into moderate awareness advantage (up to 26 hours), and that geo¬location of users within or outside of the hurricane¬affected area plays a significant role in determining the scale of such an advantage. Emotional response appears to be universal regardless of the position in the network topology, and displays characteristic, easily detectable patterns, opening a possibility to implement a simple “sentiment sensing” technique that can detect and locate disasters.
Kryvasheyeu Y, Chen H, Moro E, Van Hentenryck P, Cebrian M (2015)
Performance of Social Network Sensors during Hurricane Sandy
PLoS ONE 10(2): e0117288. doi:10.1371/journal. pone.0117288
By this time (2014 2015) it was well established that Twitter is a platform that is quite useful during natural and technological disasters. Researchers thoroughly studied the role of online services in facilitating the flow of emergency related information, detecting events online, and crowdsourcing relief efforts. Still, with rare exception (Guan and Chen, 2014, Using social media data to understand and assess disasters), most of the studies up to this point were information related and shaped the field of what is now called crisis informatics. Now, the next step was not only detecting information about the disaster but could we infer how much damage was happening to the geographical communities using just Twitter data? Our next move was a long shot, as we thought this would be beyond what could be extracted from Twitter. One thing is information, at which we know social media is good, but real world damage? That was a much higher level of impact, and we were not sure at all that the statistical links survive the noise present on Twitter.
So we set out on the course of analyzing the geospatial distribution of tweets during Superstorm Sandy. Yury’s preliminary results indicated that normalized online activity (political messages on the topic per capita) are in direct relationship with proximity to the disaster zone, with a sharp increase closer to the landfall location. This gave us hope that the driving force behind tweeting was a combination of factors that make tweeting relevant: how dangerous the event, how close it is, how obvious its manifestations (winds, storm surge, etc.) and how severe the consequences? We felt that the relationship between virtual activity and reallife damage could be detected.
Measures of real world damage are difficult to obtain. Fortunately for us, Yury Kryvasheyeu developed a relationship with local disaster damage, particularly Colleen O’Dea (from NJ Spotlight) who was incredibly helpful in providing advice on obtaining data for Hurricane Sandy damage from multiple agencies (FEMA, the New Jersey State Department of Banking and Insurance, and the New York State Department of Financial Services).
We decided to recruit some former teammates (Esteban Moro, James Fowler) to aid in assessing the statistical analyses, which we considered more severe than those in the previous papers. To crunch the data, James also brought on board a brilliant young climate scientist, Nick Obradovich, who was pursuing his Ph.D. at the Scripps Institution of Oceanography.
Having all the ingredients at hand, we compared two spatial distributions: the normalized online activity against per capita hurricane damage. And, proving our intuitive guess, the correlation was quite significant (Pearson’s correlation reaching 0.6). The results were nuanced for instance, postdisaster activity is more predictive of damage than the flurry of tweeting during the peak of the disaster. Also, a spatial resolution of the analysis affects the strength of the observed correlations. Finally, the methodology of damage assessment (what is taken into account) matters as well FEMA individual grants are moderately correlated with online activity, but together with insurance data, the relationship is much stronger (suggesting that the more complete the picture of the monetary damage, the more stable relationship is). Importantly, we verified our findings for other events throughout the US and found similar result across spatial scales and types of threats: largescale storms and tornadoes, floods, mudslides, landslides, and earthquakes.
In summary, finer details aside, the major result is exciting virtually zero cost solution for “nowcasting” disaster damage! Not only that: our method could also help in the expost evaluation of the catastrophe, by matching official reports and predictive tools (based on, say, the hurricane path and fragility simulations) with social media data and assessing the impact, management, and effectivity of the implemented measures during the disaster. By monitoring the Hurricane using social media, emergency managers can take action on those areas where social media displayed abnormally high activity. In some countries with less disaster preparedness, there is considerable interest in exploring the social media in emergency response. Our studies are positive steps in this direction: They indicate that social media captures some elements that are hard to obtain by traditional means.